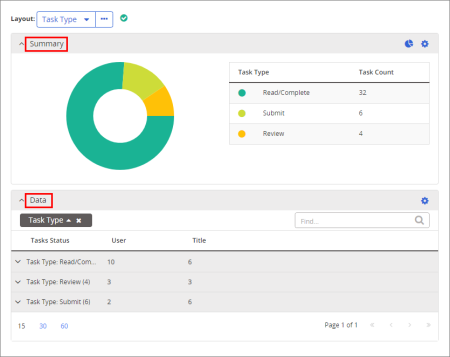
When you click View Report in a next-generation tasks report, the results are displayed in two major divisions called the Summary pane and the Data pane.
The Summary pane contains a chart and a table of data pertaining to the current report layout. You can modify or use the Summary pane in the following ways.
Note: You can save changes you make to the Summary and Data panes by creating a custom layout (see Working with Custom Layouts).
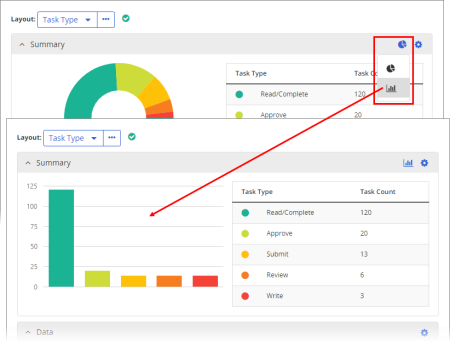
A stylized pie chart is displayed by default. To change to a bar chart, click ![]() , and then click
, and then click ![]() .
.
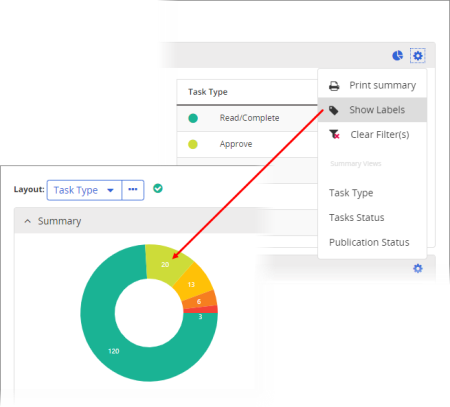
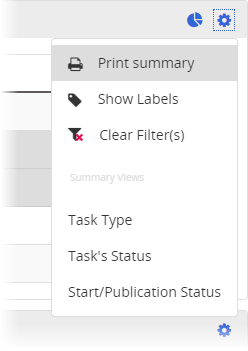
To show labels on chart elements, in the Summary pane header, click ![]() , and then click Show Labels.
, and then click Show Labels.
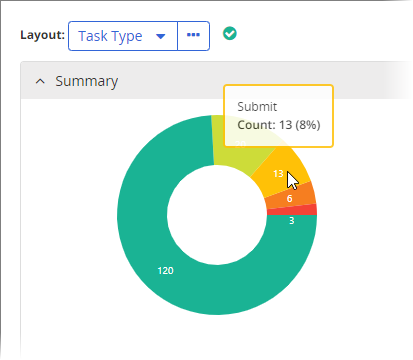
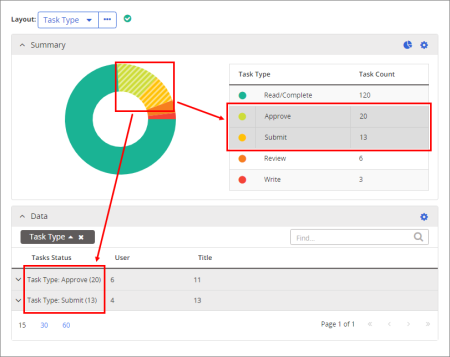
To see the details behind a chart element, simply point to it.
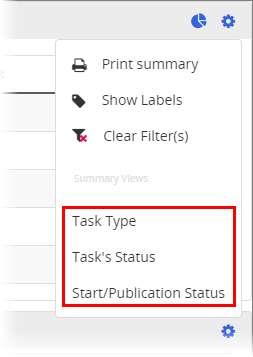
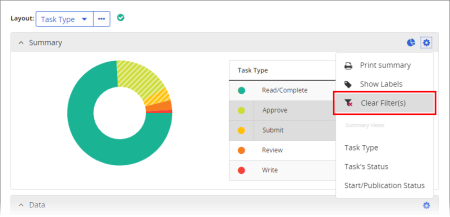
The default or current Layout selection determines which Summary and Data pane views are displayed. To change the Summary view without changing the current Data pane layout, in the Summary pane header, click ![]() , and then click a view.
, and then click a view.
Click a chart or table element to show only that type or status in the Data pane. To filter by multiple types or statuses, hold down the Ctrl key while you click chart or table elements.
To clear a chart or table filter when only one is selected, click the selected element. To clear multiple selected filters at once, in the Summary pane header, click ![]() , and then click Clear Filters.
, and then click Clear Filters.