Working with the Report Data Pane
When you click View Report the results are displayed in two divisions called the Summary pane and the Data pane. The Data pane contains a grid of data pertaining to the current report layout. You can modify or use the Data pane to apply various groupings to the report data, and export and print the report results.
Note: You can save changes you make to the Summary and Data panes by creating a custom layout (see Working with Custom Layouts).
Reveal column data
Each column in the Data pane represents a specific type of data. Grouping is a way of organizing report data by one or more columns. You can think of a grouping row as a section heading with a list of relevant data rows below it.
-
To reveal the rows in a grouping, expand the grouping heading.
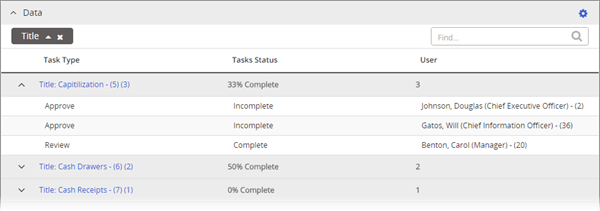
Add groupings
Each report has default groupings for each of its layouts. Groupings are shown directly above the grid in the grouping bar.
-
To add a grouping, drag a column heading into the grouping bar and drop it in the desired grouping position. You can also arrange grouping position anytime by dragging a grouping to a new position in the bar.

Note: Not all grouping combinations make sense. Experiment to find the ones most useful to you.
-
To remove a grouping and add it back into the grid as a column, click
 .
.
Change the grouping order
By default, group headings are sorted alphanumerically from least to greatest.
-
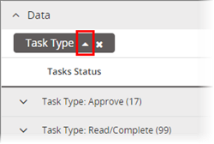
To change the sort order, click
 or
or  .
.
Arrange and sort column data
-
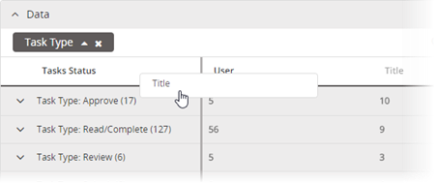
To change column order, drag a column to a different position.
Note: Columns currently selected as groupings are locked in place and cannot be rearranged.
-
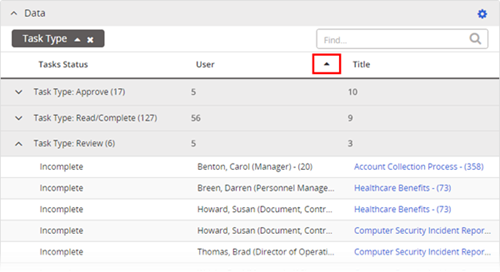
To change the sort order of data in a column, click the column heading to display the current sort order (up or down arrow), and then click it again to reverse the order.
Filter column data
You can use filters to refine report results to include only those records that match certain column data criteria.
- In the Data pane header, click
 , and then click Show Column Filters.
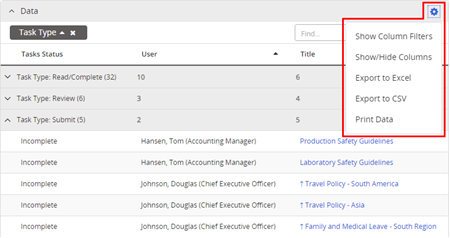
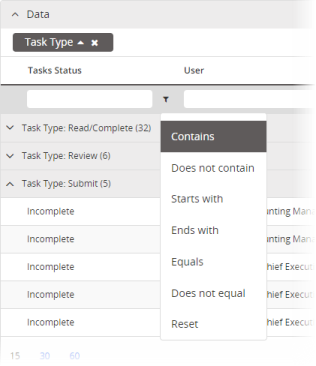
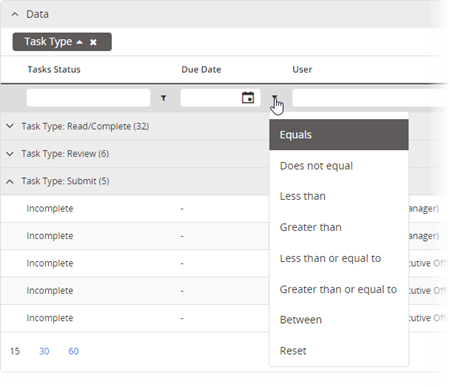
- (Optional) By default, a filter will include only those records whose filtered columns contain the text you specify or are equal to the date you specify. Do one of the following:
- To change a text column's filter criterion, point to
 , and then click Does not contain, Starts with, Ends with, Equals, or Does not equal.
- To change date column's filter criterion, point to
 , and then click Does not equal, Less than, Greater than, Less than or equal to, Greater than or equal to, or Between.
- To change a text column's filter criterion, point to
- Do one of the following, depending on the column type.
- For columns containing text, start typing text in the filter box. The filter is immediately applied as you type.
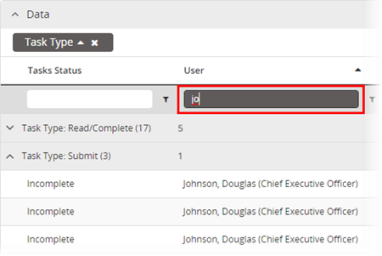
- For columns containing dates, click
 , and then select a date. (If the filter criterion is Between, select both a start and end date.) To clear a filter, point to
  , and then click Reset.
- For columns containing text, start typing text in the filter box. The filter is immediately applied as you type.
Export column data
-
After customizing the report results, in the Data pane header, click
 , and click Export.
 -
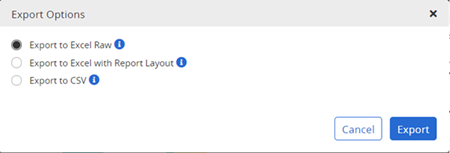
Choose one of the following options:
-
To include all data in a flattened structure with linked content titles, click Export to Excel Raw.
-
To maintain the current report layout, including groupings and selected columns only, but not including content title links, click Export to Excel with Report Layout.
-
To export the current visible columns added to the report while retaining their order and column filters, click Export Visible Rows and Columns to Excel.
-
To export all data, including all optional columns, in comma-separated values (.csv) format, click Export to CSV. This option does not include content title links.
-
-
Click Export.