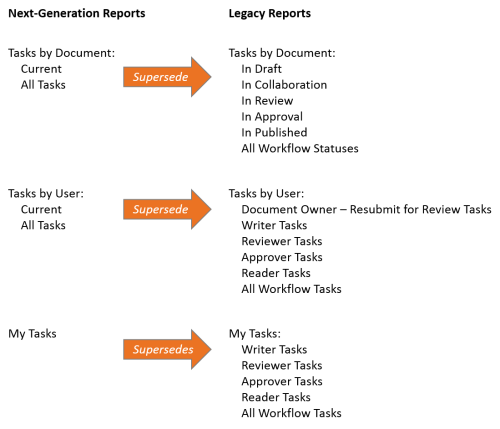
The release of PolicyTech version 9.6 introduced the next generation of task reports and the first phase of legacy report replacement, as shown below.

Note: Replaced reports will continue to be available for a time in the Superseded Reports section.
In legacy reports, all report customization and manipulation is done using report settings, with the report results generated as a static document. In next-generation reports, you set a minimum of report options, such as selecting the documents and users to include and adjusting a few basic settings, to generate report results that act as an initial framework.
The results of a next-generation report consist of a Summary and a Data pane, each of which is dynamically customizable to show precisely the information you need.
In the Summary pane, you can select a chart type and click on a chart or table section to immediately filter the results in the Data pane.
In legacy reports, the data layout is predefined, and you have a relatively limited number of options for controlling which pieces of data to include and how to arrange them. Next-generation report data is shown in a dynamic grid in which you can size, rearrange, and sort columns, filter column data, and choose from dozens of columns to include, as compared to the two or three optional columns in legacy reports.
You can also organize the data into groupings by simply dragging column headings into the grouping bar and then arranging them. For example, you might want to group data first by task assignee, and then by task type, and then by document title. Each grouping becomes an expandable section heading within the Data pane.
The groupings also become sections in the printed or saved report.
If you've used superseded reports and want to produce approximately the same results in a next-generation report, refer to the following
Recreating a Superseded Tasks by Document Report