Recreating a Superseded Tasks by User Report
Follow these instructions to recreate any of the following superseded Tasks by User reports:
- Writer Tasks
- Reviewer Tasks
- Approver Tasks
- Reader Tasks
- Document Owner - Resubmit for Review Tasks
- All Workflow Tasks
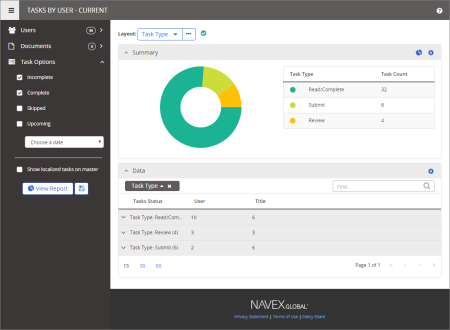
- Click Reports, click Tasks by User, and then click Tasks by User - Current.
- Select users as you normally would (see Selecting Users), and then click OK.
Some of the report options have different names than those in the legacy report. Also, some of the options you used to set before viewing the report you'll now set after viewing the report.
- If you want to limit the users to only those assigned to specific documents, click Documents, and then select documents as you would for document-based report (see Selecting Documents).
- Under Task Options, select the types of tasks whose assigned users you want included in the report.
|
Notes:
- Incomplete and Complete are selected by default, whereas, in the legacy report, Only Incomplete Tasks is selected by default.
- While there was the Only Overdue Tasks option in the legacy report, in this report you can see which tasks are overdue by adding the Due Status column to the data grid after clicking View Report.
- In the legacy report, if you select Only Complete Tasks or Incomplete and Complete Tasks, you are given the option of specifying a date range. In this next-generation report, you can specify a date range by applying a Between filter to a date column in the Data grid after clicking View Report.
|
- Click View Report.
- For Layout, select Task Status.
The new Layout option determines what type of information appears by default in the Summary pane and how the grid is organized and grouped by default in the Data pane. For the Data pane, The Task Status layout groups report data first by assignee and then by task status, just as in the legacy report.
- Choose how you want information in the Summary pane displayed (Working with the Summary Pane).
|
Notes:
- There is no Include Graphs option in next-generation reports; the chart portion of the Summary pane is always displayed.
- Unlike in the legacy report, the chart in this report is a visual representation of the table data in the Summary pane.
- The Summary table has been simplified and is different for each Layout option.
- Some of the summary table headings in the legacy report are no longer shown in any of this report's Summary tables. However, some of the legacy table headings can be added to this next-generation report's Data grid using Show/Hide Columns.
|
- Customize the Data grid to show only the data you need in the way you want it represented (Working with the Data Pane).
Notes: The default task columns in the legacy report are not the same as those in this report's Data grid. Use Show/Hide Columns to select the columns you want in the report.
- (Optional) To save all of the report's current document and user selections, option settings, and customizations for future use, click
 , type a name and description, and then click OK.
- (Optional) Print or save the current report results (see Printing or Saving Report Results).

 , type a name and description, and then click OK.