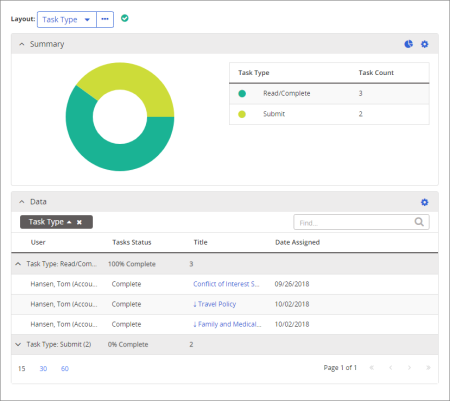
Important: This is one of several next-generation, dynamic grid reports that are fundamentally different than other PolicyTech reports you may have worked with (legacy reports). In legacy reports, all report customization and manipulation is done using report settings, with the report results generated as a static document. In next-generation reports, you set a minimum of report options—such as selecting the documents and users to include—to create report results in the form of an initial framework. The initial report results consist of a Summary section and a Data section, each of which is highly customizable to create precisely the data representation you need.
Shows information about your assigned tasks. You can choose to include incomplete and complete tasks as well tasks in upcoming levels.
All users with any assigned role or system permission.
Task options available for this report are displayed on the left.
Select Upcoming to include information about your assigned tasks in a subsequent level in an active workflow status. For example, if a document to which you're assigned has three approval levels and is currently in level 1 of the Approval status, selecting Upcoming would also include information about your tasks assigned to approval level 2 or 3.
Select Show optional tasks to include information about complete, optional reading tasks, where you marked documents as read even though you were not assigned reading tasks for those documents.
Note: You can also click View Report at any time while setting report options. After changing an option, remember to click View Report again to refresh the report contents.