Report: Questionnaire Statistics
Description
Description
For the selected questionnaires or documents with questionnaires, shows results statistics for each question and answer.
Available to users with the following roles or permissions:
Manager, Report Manager, Administrator
How to Generate
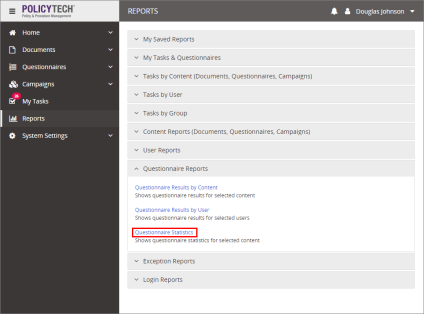
- Click Reports.
- Click Questionnaire Reports, and then click Questionnaire Statistics.
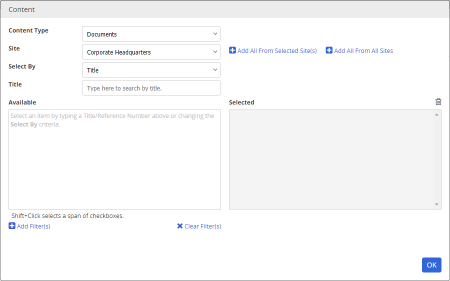
- Select content items to include in the report (see Selecting Content for help), and then click OK.
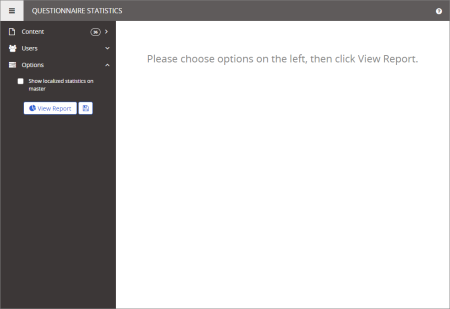
All options available for this report are displayed on the left. Notice that the number of currently selected content items is displayed after the Content option, which you can click anytime to change your selection.
Note: If you change your content selection after clicking View Report, click View Report again to refresh.
- (Optional) To limit the selected content items to only those assigned to specific users, click Users and make selections in the same way as you would for a user-based report (see Selecting Users for help).
- (Conditional) If Localization Workflow is enabled, under Options, select Show localized statistics on master if you want the questionnaire statistics from synced localized copies included with the master document's/questionnaire's statistics.
Note: To access a saved report, click Reports, and then click My Saved Reports.
- Click View Report.
Note: You can also click View Report at any time while setting report options. After changing an option, remember to click View Report again to refresh the report contents.
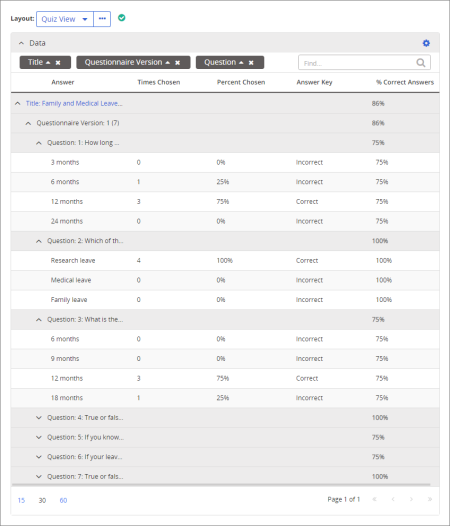
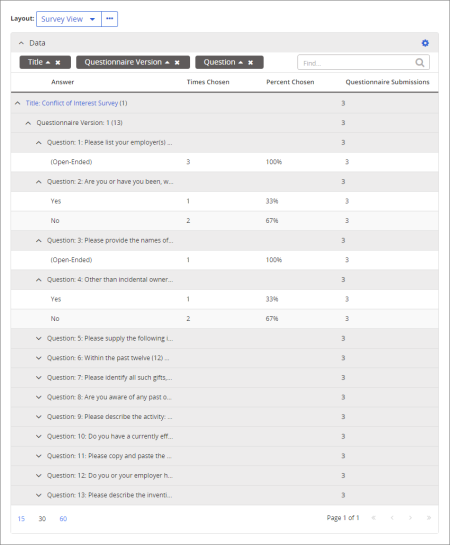
- For Layout, select Quiz View or Survey View.
Note: Quiz View is the layout selected by default when you view this report. To select a different default layout, select that view, click  , and then click Set as default.
  appears when the current default layout is selected.
Quiz View includes the Answer Key column to show which are the correct answers, and the % Correct Answers column.
Survey View includes the Questionnaire Submissions column to show how many times each questionnaire has been completed.
- Customize the Data grid to show only the data you need in the way you want it represented (Working with the Data Pane).
- (Optional) After setting up the Summary pane and Data grid, create a custom layout to save your changes for future use (see Working with Custom Layouts).
- (Optional) To save all of the report's current content item and user selections, option settings, and customizations for future use, click
 , type a name and description, and then click OK.
- (Optional) Print or save the current report results (see Printing or Saving Report Results).